
Market Data · NSE & BSE
Read the market, candle by candle.
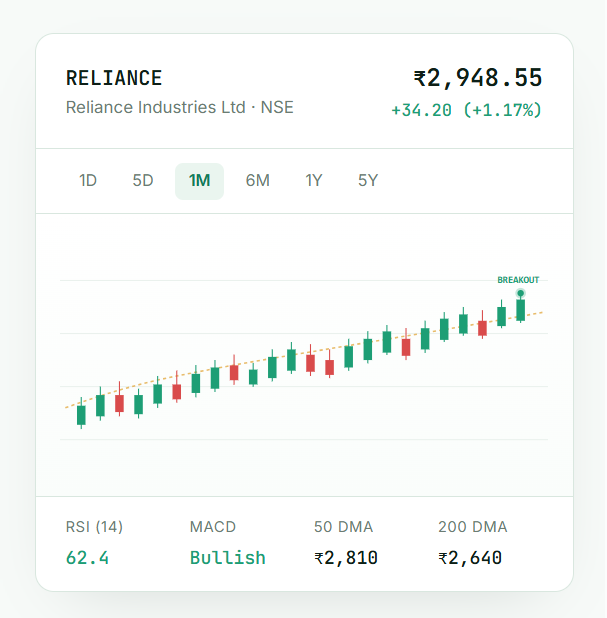
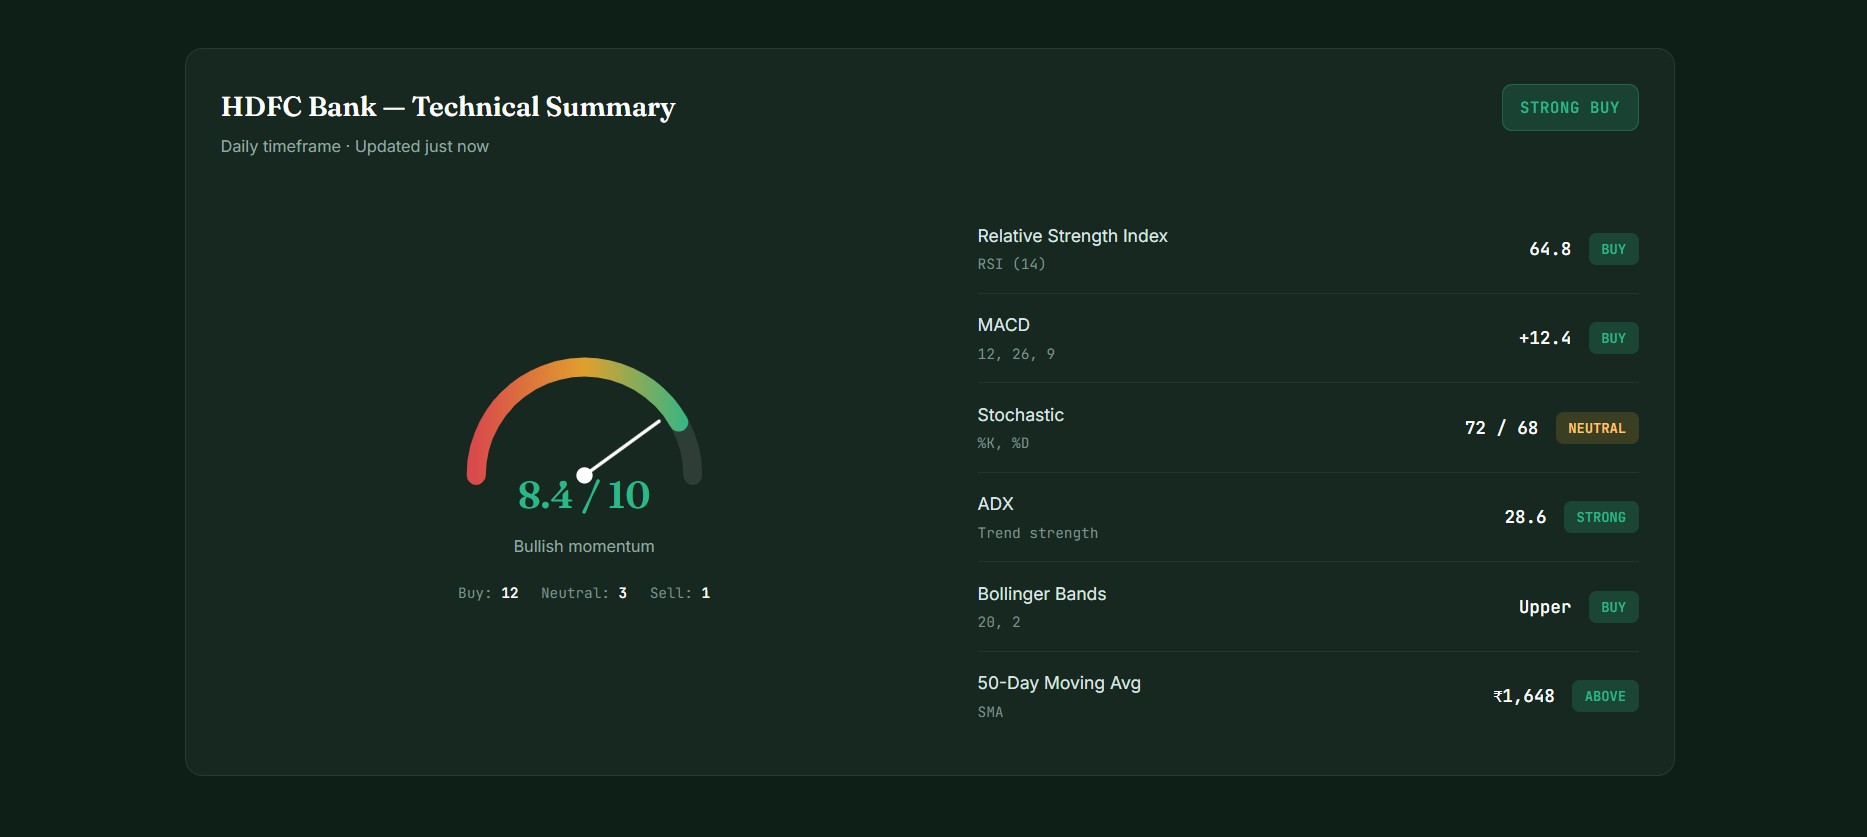
50+ indicators, real-time pattern recognition, and breakout alerts for every NSE & BSE listed stock — built for the way Indian retail investors actually trade.
Indicators
The toolkit, explained simply.
Six core indicators every trader should understand. Tap any card to see how to read it and when it works best in Indian markets.
SMA / EMA
Moving Averages
The 50 and 200 DMA are India's most-watched trend filters. A golden cross signals long-term strength.
STOCH
Stochastic Oscillator
Compares closing price to its range over time. Useful for spotting reversals in range-bound stocks.
VOL / OBV
Volume Analysis
A breakout without volume rarely sustains. OBV tracks whether smart money is accumulating or distributing.
RSI
Relative Strength Index
Momentum oscillator that measures the speed of price changes. Above 70 = overbought, below 30 = oversold.
MACD
Moving Avg Convergence
Trend-following indicator. A signal line crossover often marks the start of a fresh bullish or bearish move.
BB
Bollinger Bands
Volatility envelopes around a moving average. Narrow bands often precede a sharp breakout or breakdown.
Chart Patterns
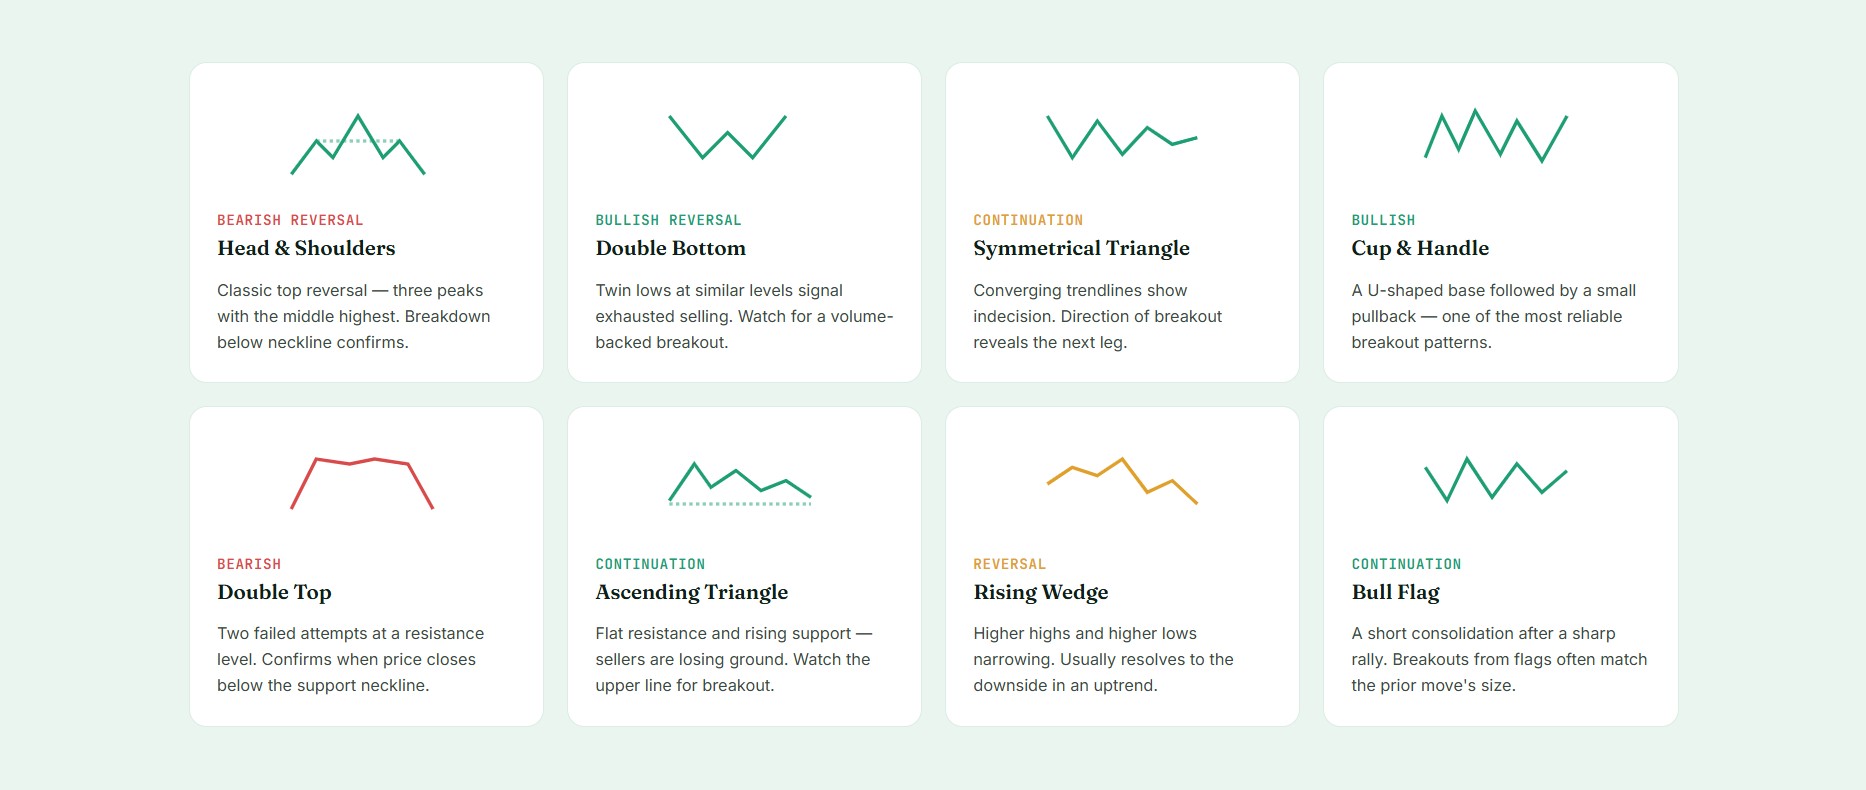
Patterns Chartchintan spots for you.
Our system continuously scans 5,200+ stocks for classical chart patterns — so you never miss a setup.
Financial Statements
The numbers that don't lie.
10 years of revenue, profit, and cash flow — so you can spot the trend in seconds.
Start investing smarter with Chartchintan
Join 10,000+ Indian investors who rely on Chartchintan for data- driven, confident decisions every single day.
Reach us via any channel you prefer for your account related queries

Send "Hi" on +91 95297 46478
from your registered number and get your trading information on FINGERTIPS
Trusted by everyday investors
Clarity people come back for.
Why first-time and seasoned investors make ChartChintan their starting point.