



Fundamental Analysis

Know the business behind the ticker.

Earnings, ratios, balance sheet strength, peer comparison, and shareholding — everything you need to judge a company's worth before you invest a single rupee.

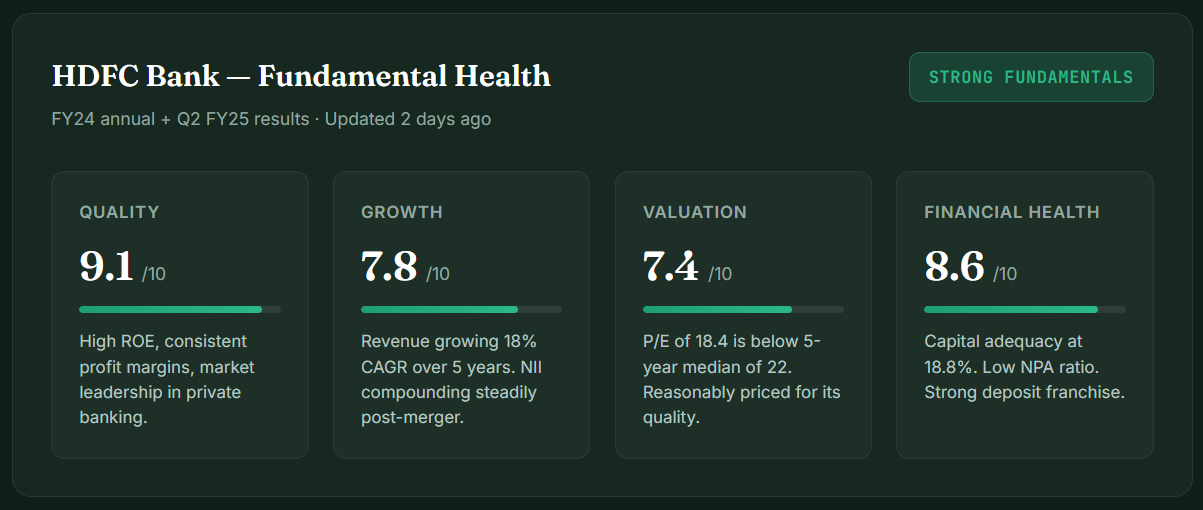
Fundamental Scorecard

Four pillars. One verdict.

Every stock on Chartchintan is scored across the four dimensions that actually matter for long-term investors.


Quality
9.1/10
 
High ROE, consistent profit margins, market leadership in private banking.
 
Growth
7.8/10
 
Revenue growing 18% CAGR over 5 years. NII compounding steadily post-merger.
 
Valuation
7.4/10
 
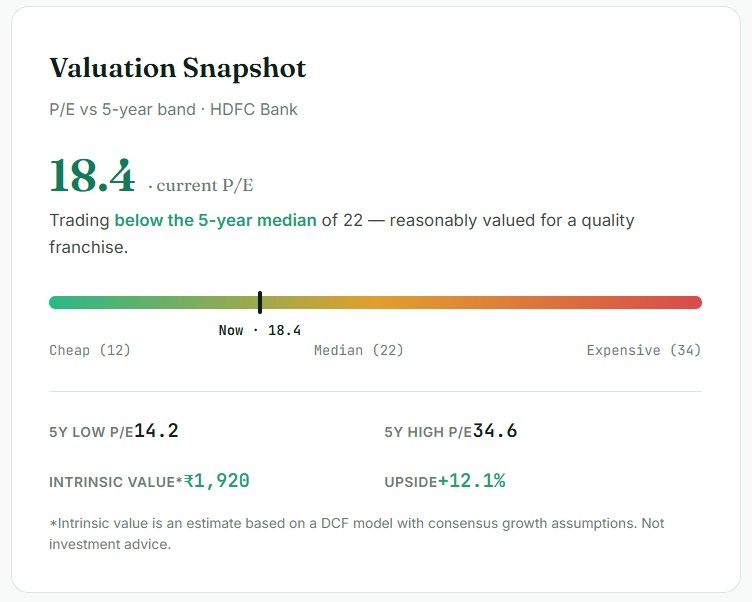
P/E of 18.4 is below 5-year median of 22. Reasonably priced for its quality.
 
Financial Health
8.6/10
 
Capital adequacy at 18.8%. Low NPA ratio. Strong deposit franchise.

Key Ratios

Six numbers that tell the story.

The ratios every retail investor should understand — explained in plain English, with sample readings.


P/E

Price-to-Earnings

How much you pay for every ₹1 the company earns. Lower is cheaper — but always compare with peers.

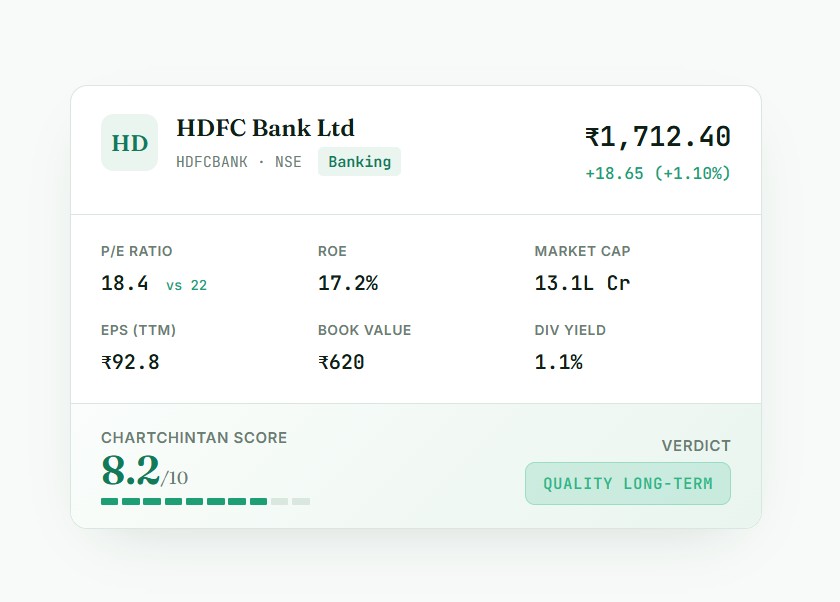
HDFC Bank · TTM                18.4 Fair

ROCE

Return on Capital Employed

Profit generated per rupee of total capital. Best for comparing companies with different debt levels.

Industry Avg              14.6% Healthy

P/B

Price-to-Book

How much you pay relative to net assets. Most useful for banks, NBFCs, and asset-heavy businesses.

HDFC Bank            2.8 Reasonable

D/E

Debt-to-Equity

How much the company borrows vs how much shareholders own. Lower = safer, but banks & NBFCs are exceptions.

Non-Financial Stock < 1.0 Safe

ROE

Return on Equity

How efficiently the company turns shareholder money into profit. Consistent 15%+ ROE signals quality.

HDFC Bank · FY24           17.2% Strong

Div Yield

Dividend Yield

Annual dividend as % of share price. A high yield can mean great income — or a falling stock. Check both.

HDFC Bank       1.1% Modest

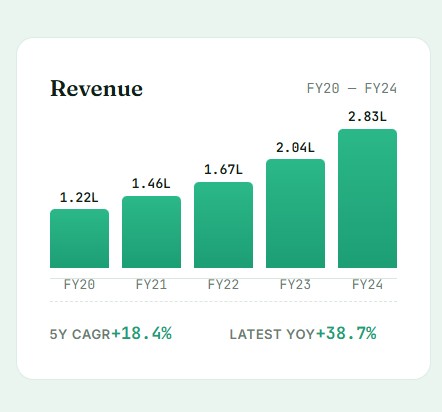
Financial Statements

The numbers that don't lie.

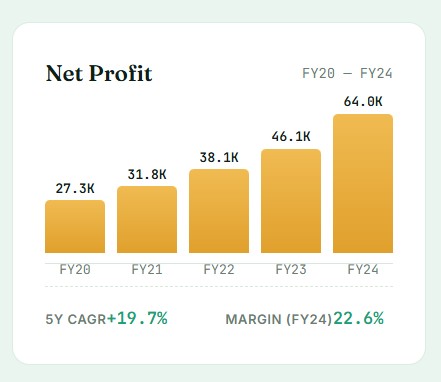
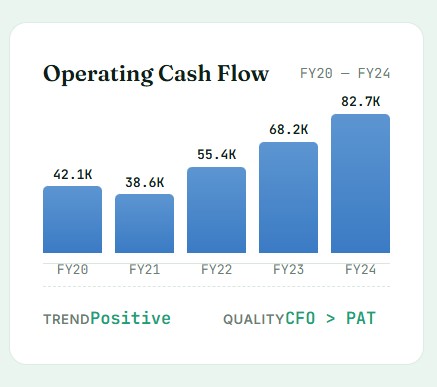
10 years of revenue, profit, and cash flow — visualised so you can spot the trend in seconds.

Peer Comparison

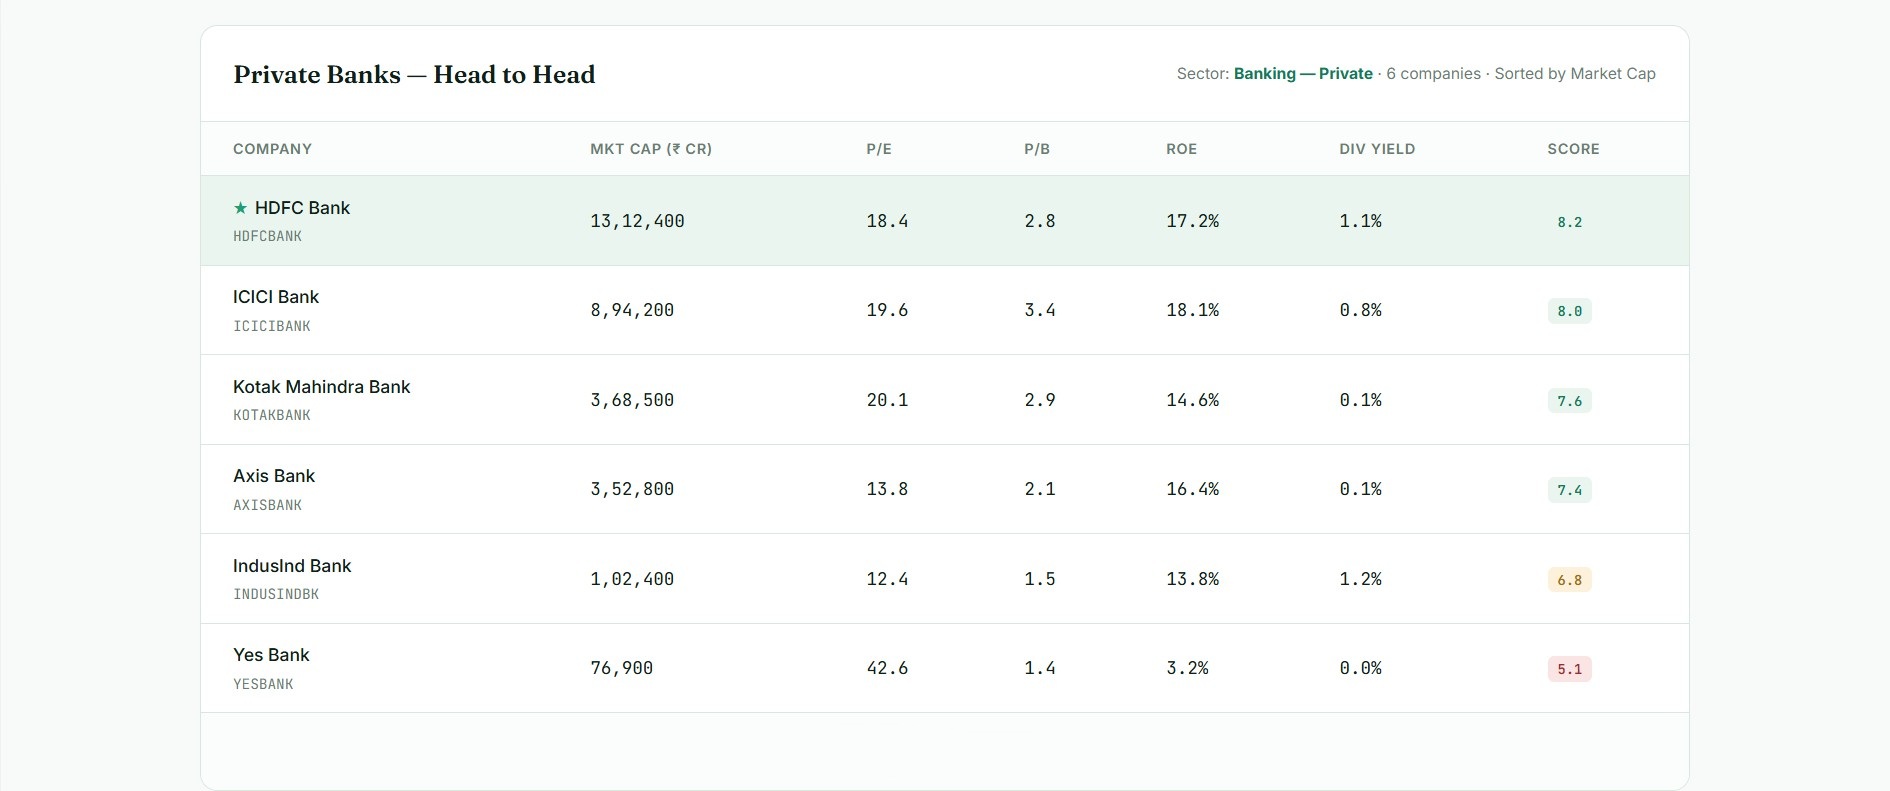
How it stacks up against the sector.

A stock looks good in isolation — but the real test is how it compares with rivals in the same business.

What is fundamental analysis?

Fundamental analysis is the study of a company's business — its revenue, profits, balance sheet, management, and industry — to estimate what its shares are actually worth. Unlike technical analysis (which focuses on chart patterns), fundamentals help you decide which company to own, not just when to trade it.

Which ratios should beginners focus on first?

Start with P/E (how expensive the stock is), ROE (how profitable the business is), and Debt-to-Equity (how risky its balance sheet is). These three alone will tell you 70% of what you need to know about most companies.

Start investing smarter with Chartchintan

Join 10,000+ Indian investors who rely on Chartchintan for data- driven, confident decisions every single day.

Reach us via any channel you prefer for your account related queries

Aditya Birla Money's WhatsApp Services
WhatsApp:
Send "Hi" on +91 95297 46478
from your registered number and get your trading information on FINGERTIPS

Trusted by everyday investors

Clarity people come back for.

Why first-time and seasoned investors make ChartChintan their starting point.